PowertrainLive
A simulation software tool for automotive engineers.
Project Type
New Product Design
My Role
UX Designer
Group
UMSI Design Clinic
Tools
Illustrator
Team Credits
Joy Yen-Chun Lin, Sheetanshu Bhardwaj, Adrienne Royce, Marisa Xheka, Maddie Purcell
Date: 2016
The Client
CSEG, Computational Sciences Experts Group, consists of professionals with automotive, aerospace, and defense backgrounds with expertise in 1D system modeling.
Target Users
Automotive engineers and their managers.
Client Goal
CSEG has built a 1D Vehicle Level Modeling Software, PowertrainLive, which predicts fuel economy and emissions for various standard vehicle models under different driving conditions. They tasked us with designing the user interface for this software.
Project Goals
Design an interface that allows automotive engineers to manipulate input variables, run the simulation, and easily switch between input and output views.
Provide a feature that consolidates simplified and customized graphs in a report for managers.
Challenges
As the only undergraduate on a team with four grad students, I was the least experienced. But even though I was not familiar with the process going in, I was able to bring new ideas. My team leader even told me she was always impressed with my creativity.
Key Takeaways
As my first UX design project, I learned the basic process of researching and designing a user interface, specifically in the context of automobile simulation software.
I learned the importance of researching and analyzing both the user experience of interacting with an interface and data visualization elements.
I discovered I enjoy UX design.
The Process
Initial Research
Client meeting, comparative analysis, user interviews
Sketches & Wireframes
Comparing among team, identifying main design features and making design decisions
High Fidelity Designs
User testing and design revisions
Final Presentations
Delivered final designs at Design Clinic Showcase and to CSEG
Initial Research
We started off the project with a meeting with CSEG to understand what their product does and what the input data and output data looks like. We then interviewed engineers at automotive companies and watched them interact with the current simulation and modeling tools they used. From there, we moved to conducting a comparative analysis of these similar simulation and automotive software and researched data visualization methods to explore how to best design the graphs in our interface.
Interview Participants
Automotive Research Engineer @ Ford
Development Engineer @ Bosch
Automotive Parts Developement Engineer @ MAHLE
Simulation Engineer @ Chevy
Automotive Manager @ CSEG
User Needs
Engineers want an easy switch between input and output screens.
Managers want customized graphs for final report.
Interview Findings
General functions
Prefer to see numbers (input/output)
Like option of frequently visited tab
Certain variables are frequently
Checkboxes preferred for selection
Workspace/Input
Input manipulated and simulation run multiple times
Function shortcuts used
User doesn’t get feedback from the system
Want split screen
Progression bar wanted when running simulation
Output screen
Want customized output table layout
Prefer stacked graphs when comparing data
For final data, prefer showing results in different graph, no more than two/three lines on the same graph
Ability to export to different file formats
Want to zoom in to check for a specific region/point, capable of manipulation
Critical results vs detailed ones → want brief summary tab and detailed results for each component
Comparative Analysis - Similar Automotive Software
AVL CRUISE - vehicle system simulation tool for fuel economy, performance, emissions, and drivability.
Autonomie - simulation tool for vehicle energy consumption and performance analysis.
Sketching
We started off sketching individually, each taking our first stab at an interface design.
White Board Team Sketching
Then we came together and talked out our ideas, trying different design options and making decisions.
Wireframes and Low-Fidelity Designs
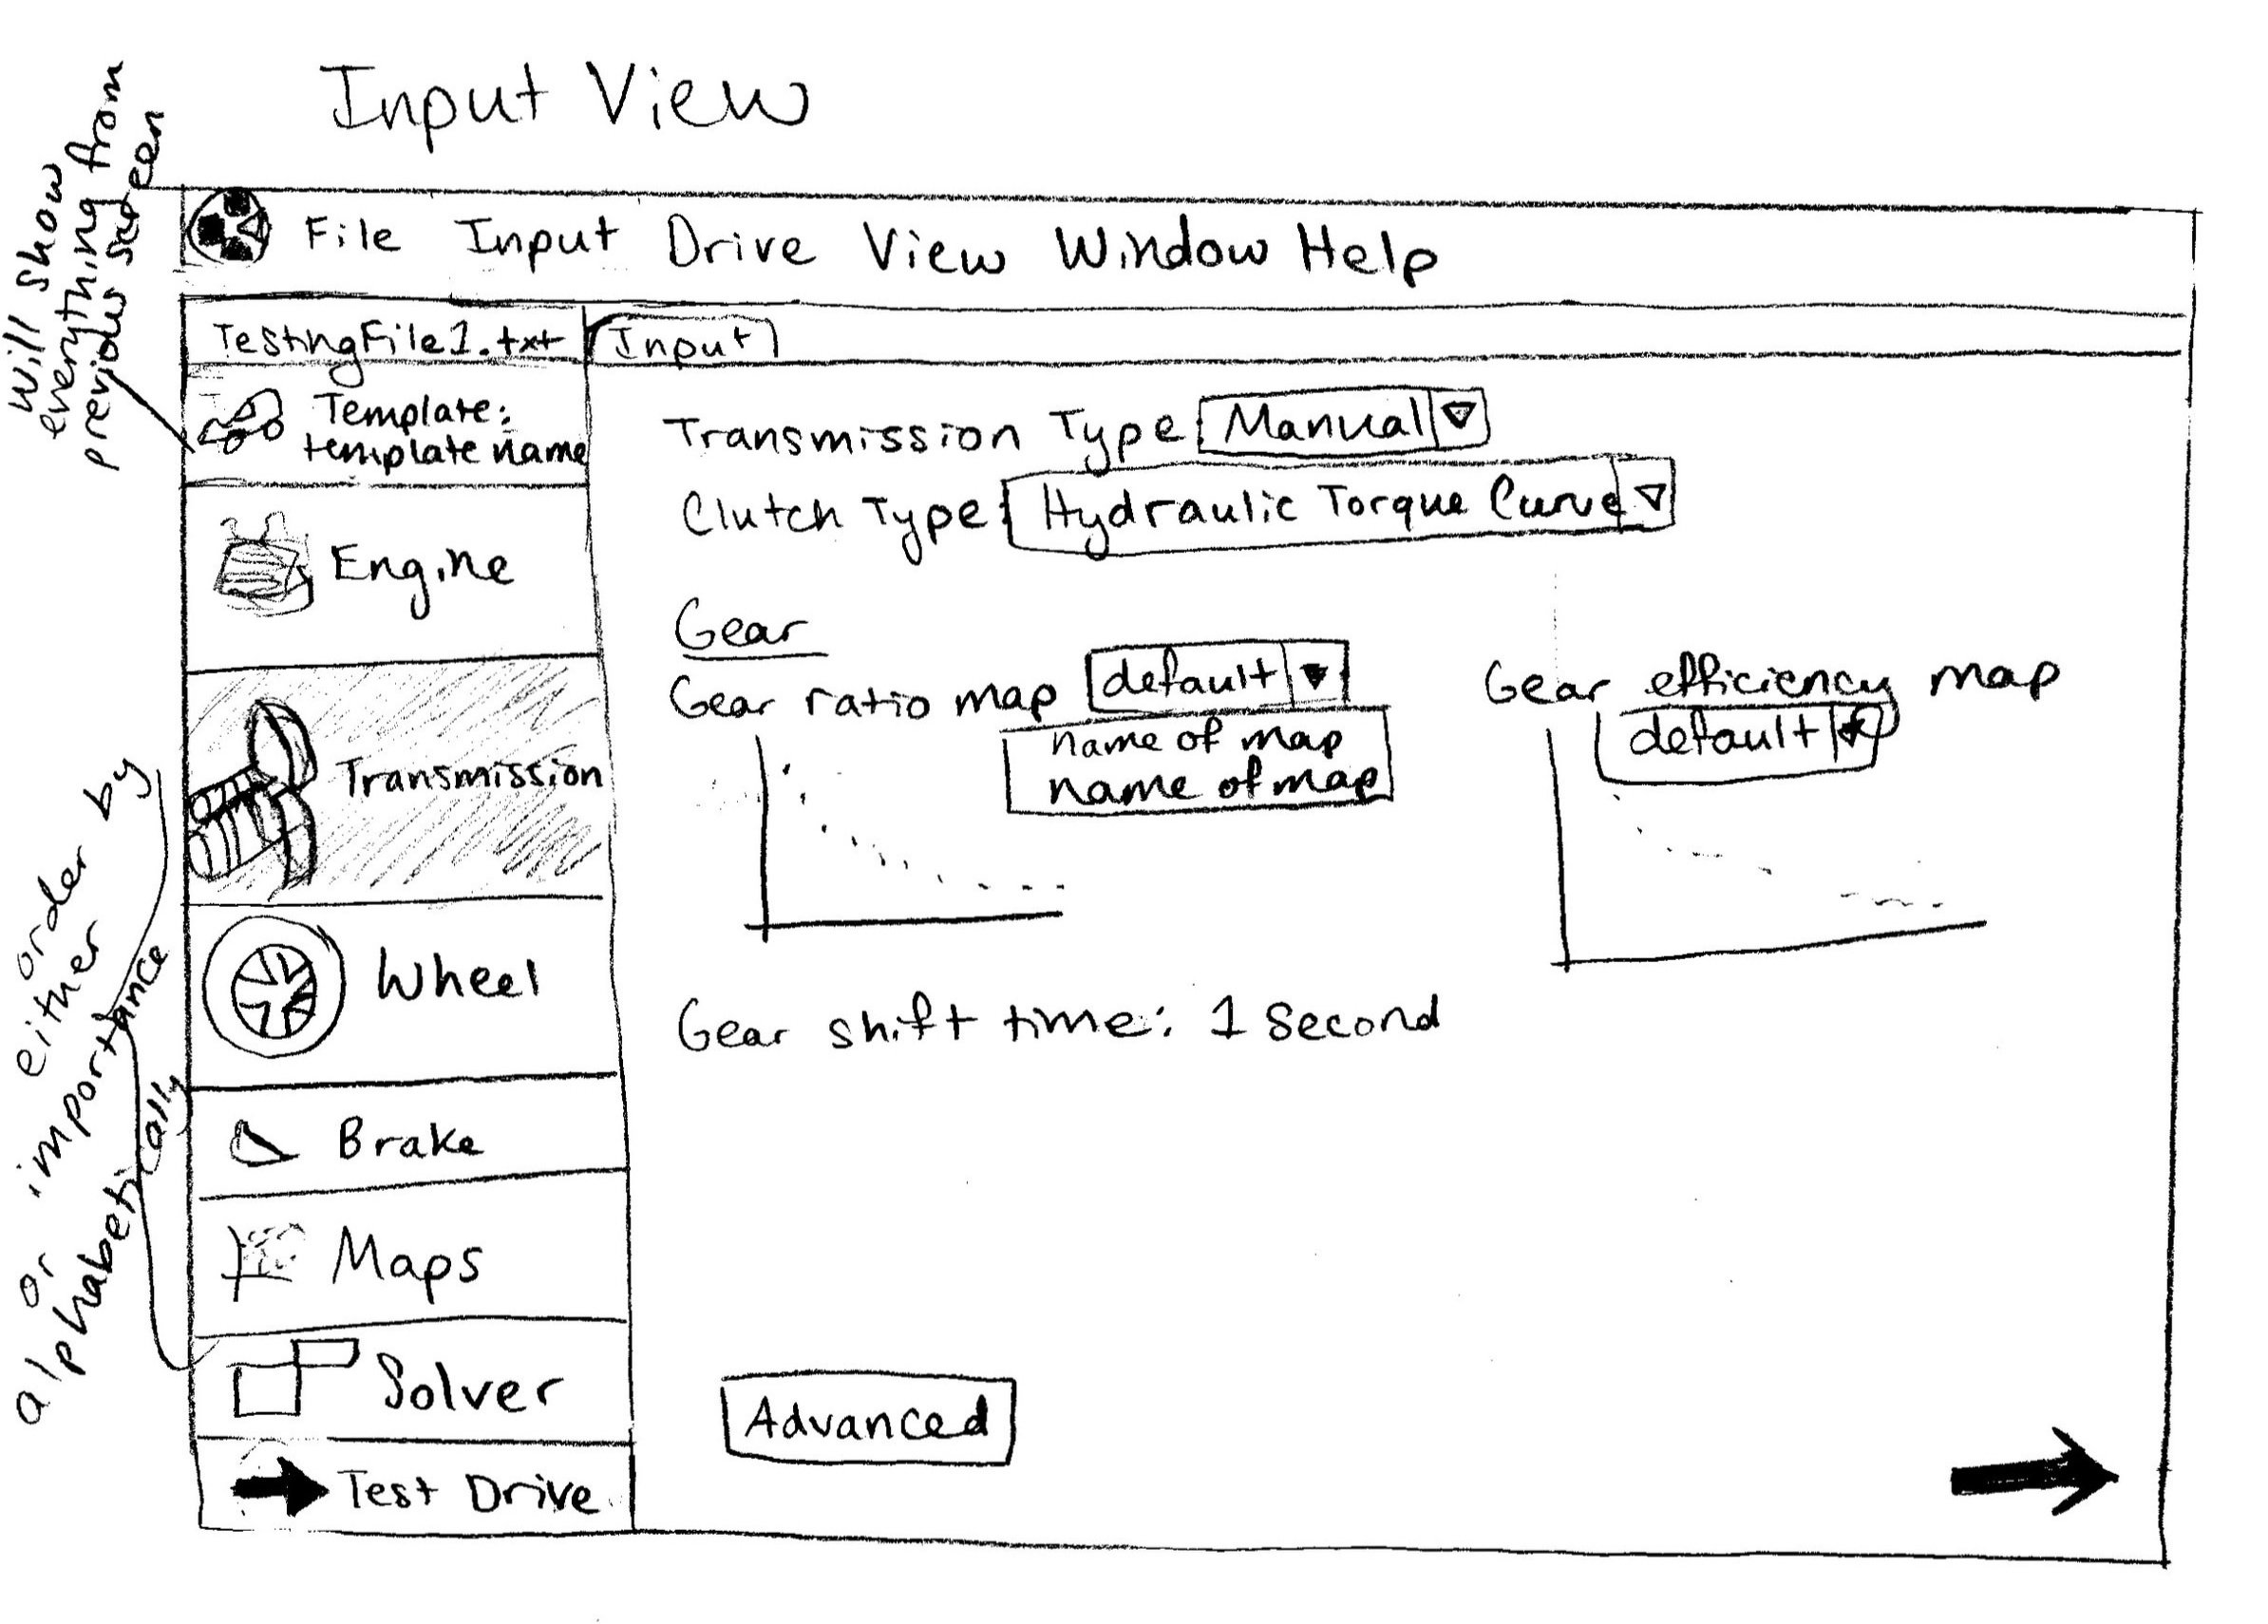
After coming to a general consensus of the features and general layout that we wanted our screens to have, we made wireframes and lo-fidelity designs. These designs further allowed us to analyze our decisions and see how everything worked together on the screen.
High-Fidelity Designs
After looking at our lo-fi designs, we realized we had chosen the dimensions of the old standard size of a computer screen. Thus, we changed to a wider screen size and added in visual design elements such as a new color scheme and shadows to the cards to give them more depth.
Workspace
Edit Graph
Report for Managers
Our Designs in Use
CSEG has taken our designs to build the interface for their new software, PowertrainLive, which is now on the market.


